
Ticker Reports for July 23rd

5 Stocks to Buy and Hold for the Rise of Physical AI
Physical AI, which bridges today’s digitally focused AI to machines, robots, and devices that can interact in real-time, learning and adapting along the way, is the future of AI.
The critical takeaway is that the future of AI is here, today. While not widespread, technologies such as Automated Vehicles (AVs), warehouses, and business systems are in use and being developed into the next industry-disrupting technologies that investors can capitalize on.
And the gains will be made over the next few years due to the rapid advancement of technology. This is a look at some of the top names that are set to benefit from physical AI in 2025 and beyond.
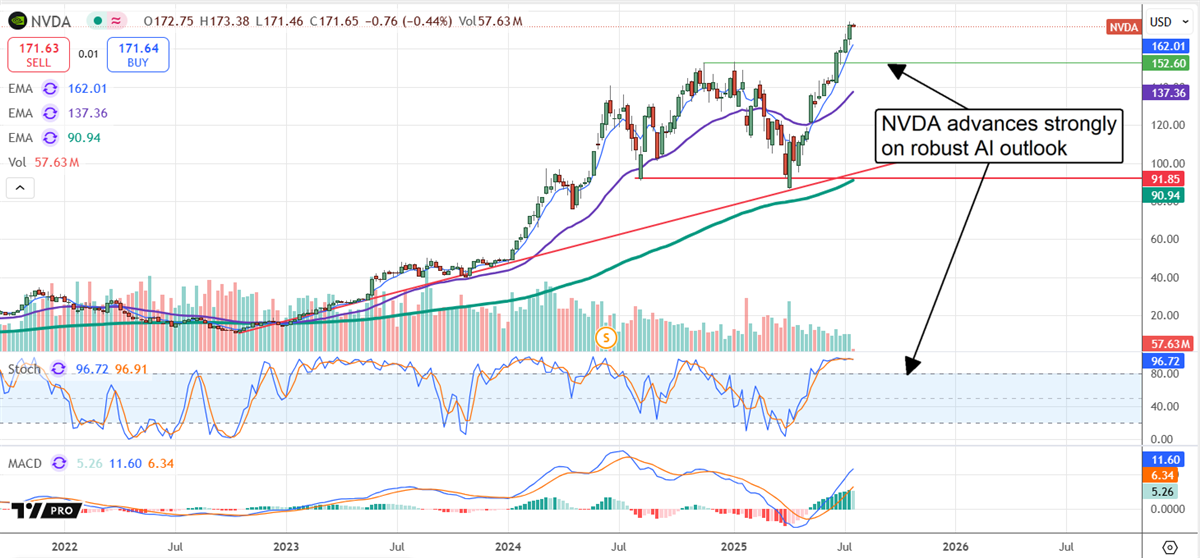
NVIDIA Will Always Be the Leader in AI
NVIDIA’s (NASDAQ: NVDA) advantages lie in its GPU technology, which unlocked the data center industry and subsequently AI, its first-mover advantage, and its aggressive strategy for developing its full-stack offerings and expanding into new verticals.
NVIDIA’s products and impact on physical AI will be tremendous because it all starts with the GPUs, models, training, and inference, and ends with the ecosystem of products built on them.
Specifically, NVIDIA is working on numerous fronts within several industries to develop and build the infrastructure necessary for physical AI to operate, including automotive, robotics, and smart cities.
Regarding its growth outlook, the stock is undervalued relative to its long-term earnings forecasts and could potentially increase in value by 200% over the next decade.
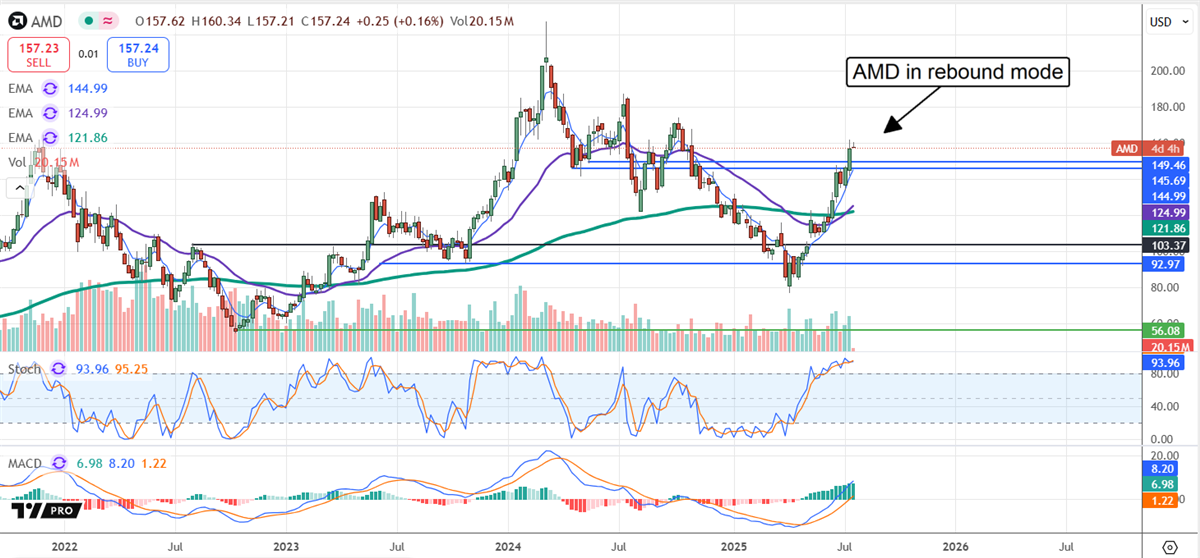
Advanced Micro Devices Brings AI to the Edge, Where Physical AI Thrives
Advanced Micro Devices (NASDAQ: AMD) struggled to match the pace with NVIDIA during the AI infrastructure boom, but is positioned to regain ground with physical AI.
Not only is it on the cusp of inflecting market share gain in the GPU and data center markets due to its superior memory and performance, but it's bringing AI to the edge.
The company’s Ryzen line is optimized with special neural processors or NPUs to facilitate AI experiences across a range of devices. The company produces other hardware and software solutions for physical AI that are critical to the industry.
Its stock price is also deeply undervalued in mid-2025, potentially gaining a high triple-digit amount within the next five to ten years.
Tesla: Look Past the Image Issues And Toward the Future of AV
Tesla (NASDAQ: TSLA) faces challenges in 2025, including CEO Elon Musk’s tarnished image, sluggish car sales, macroeconomic uncertainty, and increased competition; however, it continues to generate profits and invest in the future.
The future, according to CEO Elon Musk, is AV and Tesla’s upcoming Cybercab release. It is a fully autonomous vehicle with no visible onboard controls, serving as the basis for what will be fleets of ride-share vehicles.
The critical takeaway is that these cars are expected in 2026 and are not the only contribution to physical AI. The other noteworthy advancement is the Optimus robot, now performing tasks at a Gigafactory near you.
Tesla is highly valued in 2025 but appears undervalued when considering the long-term outlook, indicating a potential for a 100% increase.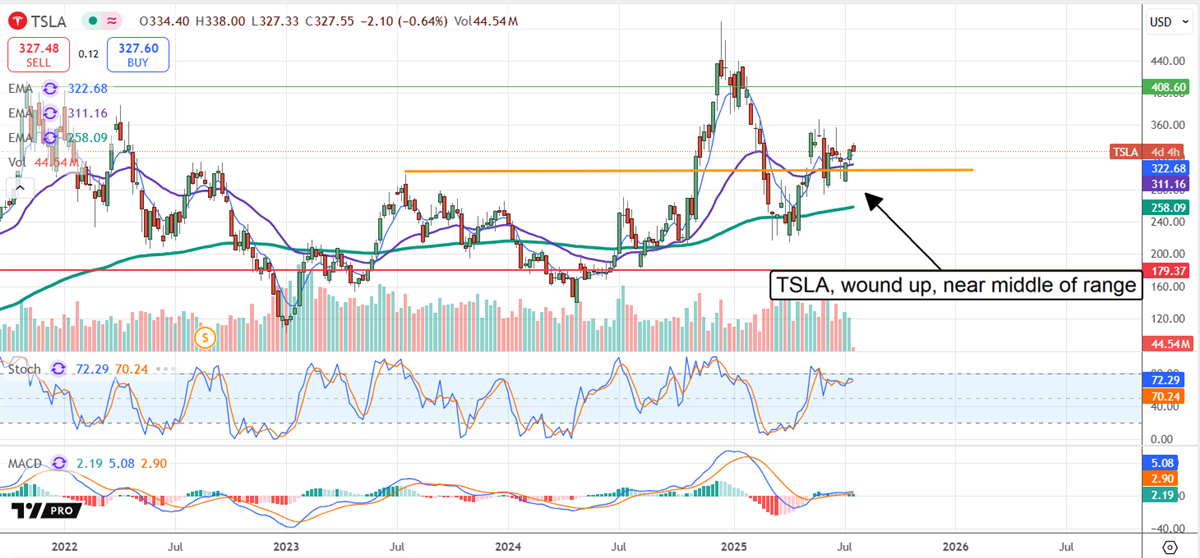
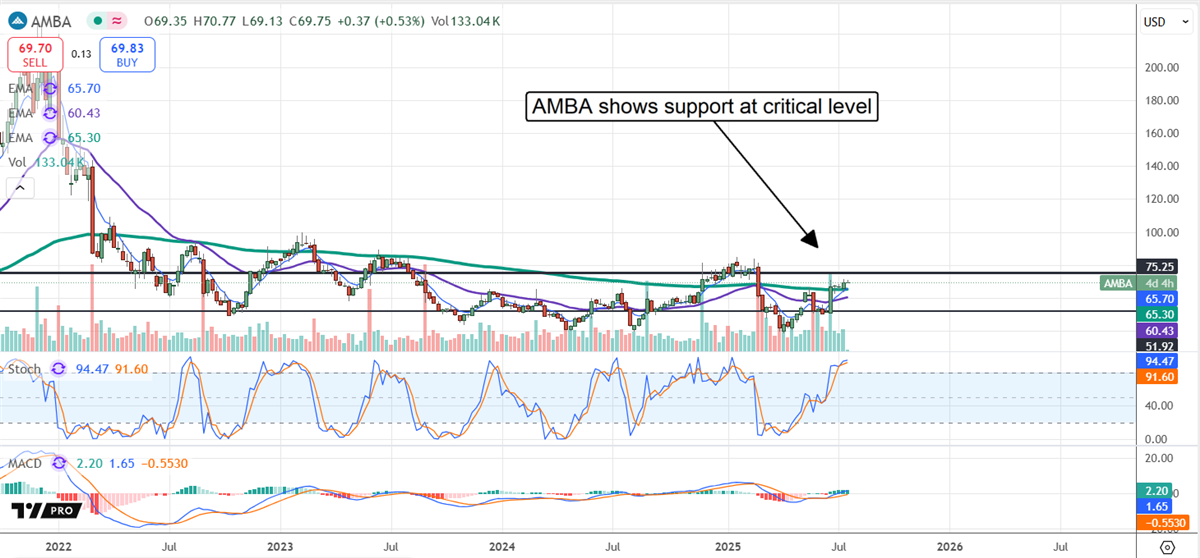
Ambarella: The Eyes of Physical AI
Ambarella (NASDAQ: AMBA) recently completed a business refocus that has it set up to be the eyes of physical AI. Once a mere image processor, Ambarella now focuses on computer vision and edge computing.
Its semiconductor platforms and systems-on-a-chip enable high-resolution video compression and advanced analytics at the edge, facilitating real-time device-based decision-making in industries such as AV, aerospace, and the industrial sector.
The business turned a corner in 2024, returning to growth, and is expected to sustain growth at a high double-digit pace for at least the next ten years, while widening its margin.
It too is deeply undervalued based on its forecasts and multiples, with the potential to rise by 100%, assuming the forecasts aren’t too low.
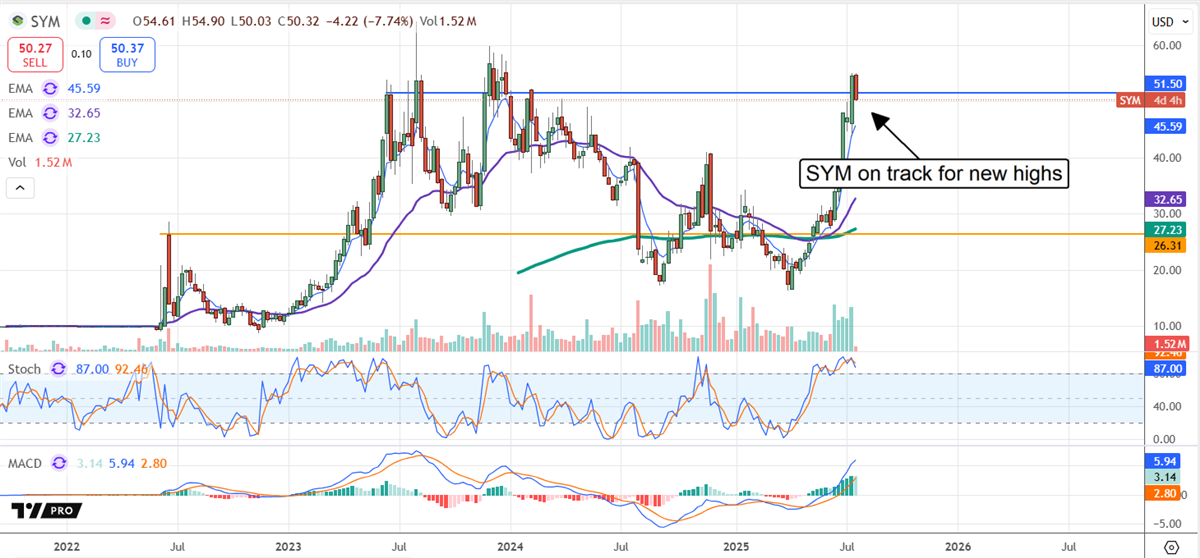
Symbotic Automates Supply Chains
Symbotic (NASDAQ: SYM) is an AI/Robotic story years in the making. Its systems are used to automate supply chain infrastructure for giants like Walmart and Amazon, which lean heavily into the technology.
Advancement includes end-to-end solutions that enhance or improve the supply chain at all levels.
Its contributions to physical AI include robots and the platform to operate them, improving efficiency, speed, and accuracy while reducing emissions and space requirements.
The story in 2025 is about executing its backlog, which is tremendous at over $23 billion as of the spring 2025 earnings release.

China just changed the game for Nvidia
China just changed the game for Nvidia

2 Chinese Stocks That Could Leave U.S. Tech in the Dust
Only two factors deliver returns when it comes to investing in stocks. While most investors would stop at the simple fact that a price goes up and realizes a profit, they fail to understand how that stock price goes up in the first place. One of the two factors is valuation multiple expansion, as measured by the commonly known price-to-earnings (P/E) ratio.
The second factor is earnings per share (EPS) growth, which directly affects company trades.
Considering these two, future expectations are of considerable importance, as companies with significant future potential EPS growth will typically command higher P/E multiples. The problem arises when EPS growth slows and P/E multiples continue to expand, which is precisely what happens in the S&P 500 and Nasdaq-100.
Most of the EPS share of these indexes is centered in the technology sector, which now carries trillions in market capitalization. Still, with slowing growth rates, the share of price appreciation is tilting more and more toward the P/E side of the equation.
This is why investors need to diversify toward the other end, EPS growth, and why companies in the KraneShares CSI China Internet ETF (NYSE: KWEB) are today’s best gold mine for future returns.
Why Chinese Stocks?
Compared to technology stocks in the United States, Chinese technology companies have seen minimal P/E expansion, yet continue to deliver EPS growth rates above those of their American counterparts. With this dynamic in place, it’s challenging not to envision a future where China outperforms, especially in the realm of technology companies.
As a more direct and diversified comparison, investors can look to the iShares MSCI China ETF (NASDAQ: MCHI), which currently has a valuation of 14.4x and has experienced massive underperformance in terms of price compared to the S&P 500 index over the past five years.
On the other hand, the S&P 500 now trades at roughly 25.0x, nearly double the valuation of its Chinese counterpart. The key difference maker to consider here is the underlying EPS growth, representing the world’s two largest economies.
Investors can simply use the top holdings as a direct representation to get a more accurate picture than the distorted indexes that overweight the best-performing stocks. For the S&P 500, this is NVIDIA Corporation (NASDAQ: NVDA). This company now forecasts an EPS growth rate of 8.6% over the next 12 months, as Wall Street expects $0.88 in EPS compared to today’s $0.81.
Contrasting the S&P 500 and NVIDIA valuation to EPS growth setup, investors can look to the Chinese index’s largest holding, Tencent Holdings Ltd. (OTCMKTS: TCEHY), and its forecasted 16% EPS growth for the next 12 months, nearly double at only half the valuation.
However, Tencent is an “over the counter” stock, which might add to the nervousness some investors feel when it comes to buying Chinese companies. The index’s second-largest holding can help alleviate these fears, as it is Alibaba Group (NYSE: BABA), a well-known name in commerce and cloud computing among many American investors.
Alibaba trades at a P/E ratio of roughly 11.0x and boasts an EPS growth expectation of 14% for the next 12 months, creating a significant divergence between the drivers behind American and Chinese stocks and their respective indexes. This is not to say the S&P 500 is a bad place to be, but rather that for those who manage their capital, China might be a good place to start diversifying.
China’s Best Choice: Alibaba Stock
Not only is Alibaba one of China’s blue-chip names, but it is also exposed to some of the best industries and businesses, which act as a major tailwind for the entire Chinese economy. With an arm in the consumer discretionary space, Alibaba’s exposure to a quickly growing middle class acts as a significant growth area, but that’s not all.
The company’s cloud computing segment, which is expanding across Asia and the Middle East, is positioning itself early in the data center and artificial intelligence landscape within economies that are expected to experience the largest GDP per capita growth in the coming years.
This is why some analysts, like Gary Yu from Morgan Stanley, see Alibaba valued as high as $180 per share today. While this view calls for a new 52-week high to be broken, delivering as much as 50% upside potential, this view doesn’t even come close to Alibaba’s all-time high of just over $310 per share.
What’s even more interesting is the recent institutional buying activity during early July 2025, as those from Kingstone Capital Partners decided to open a position worth up to $5.6 billion in one go. This allocation would make the group the largest institutional buyer outside of other, more established institutions, and a 2% owner in Alibaba as a whole.
A vote of confidence nonetheless, and an expression that investor preference truly lies in EPS growth, rather than just P/E expansion without a strong foundation behind it.

Forget Nvidia, This "Ghost Town" Company Holds the Key to the AI Boom
Forget Nvidia, This "Ghost Town" Company Holds the Key to the AI Boom

Is Former Dividend Aristocrat AT&T a Buy After Q2 Earnings?
The communication services sector is having a strong year. Its 11.41% gain in 2025 makes it the third-best performer among the S&P 500’s 11 sectors, easily outpacing the index’s 7.28% gain. It’s been a similar story for legacy telecom company AT&T (NYSE: T), which has seen its stock rise by more than 19%.
That strong performance was bolstered on Wednesday when the company reported Q2 financials before market open. AT&T announced EPS of 54 cents, topping the consensus estimate of 51 cents, resulting in a trailing 12-month (TTM) price-to-earnings (P/E) ratio of 16.79.
However, after breaking a 36-year streak of consecutive annual dividend increases, the company lost its Dividend Aristocrat status in 2022. Since then, its payout has held steady at 27 cents, down from a high of 52 cents in Q1 2022. But with strong forward guidance, is it time for income investors to reconsider AT&T?
What AT&T’s Q2 Earnings Can Tell Us
When the company reported Q2 results, it announced:
- Revenues of $30.8 billion vs. $29.8 in Q2 2024
- Net income of $4.9 billion vs. $3.9 billion in Q2 2024
- Cash from operating activities of $9.8 billion vs. $9.1 billion in Q2 2024
- Free cash flow of $4.4 billion vs. $4.0 billion in Q2 2024
Looking forward, AT&T’s earnings are expected to grow 6.07% next year from an annualized $2.14 per share to $2.27 per share. Underscoring that growth is the stock’s forward P/E ratio of 13.30, marking a 20.78% improvement over its TTM P/E multiple.
Looking at the company’s business segments, growth was seen nearly across the board. Mobility service revenues increased 3.5% year over year (YOY) to $16.9 billion. Consumer fiber broadband revenues were $2.1 billion, up 18.9% YOY. A&T reported 401,000 postpaid phone net adds in Q2, alongside 243,000 AT&T Fiber net adds, and 203,000 AT&T Internet Air net adds.
Icing on the cake, the telecom giant repurchased approximately $1 billion of its common shares as part of an enhanced shareholder return program that includes a $10 billion share repurchase authorization. On July 2, it also closed the sale of its entire remaining 70% stake in DirecTV, marking AT&T’s complete exit from the satellite television provider.
The company expects to realize $6.5 to $8 billion of tax savings from 2025 to 2027 as a result of the Trump administration’s One Big, Beautiful Bill Act. That’s forecast to result in estimated savings of $1.5 to $2 billion in 2025 and $2.5 to $3 billion in both 2026 and 2027.
Wall Street Is Bullish Despite AT&T’s Diminished Dividend Status
AT&T may have lost some of its luster when its Dividend Aristocrat status was removed in 2022. However, for investors on the hunt for a stock that provides both growth and income, AT&T’s current dividend yields 4.06%, or $1.11 per share annually.
That’s something the smart money is already on to. Short interest in AT&T stands at 89.35 million of its 7.19 billion public float—or just 1.24%. Meanwhile, institutional ownership is 57.10%, with 1,996 holders having increased their positions over the past year compared to 1,553 that have decreased them.
Much of that is rooted in AT&T’s competitive moat, which isn’t wide but is certainly well-established. The company faces considerable competition from telecom mainstays like T-Mobile US (NASDAQ: TMUS) and Verizon Communications (NYSE: VZ), but its proven ability to scale and retain customers has been critical to its recent success. That’s a large part of why AT&T expects its mobility service revenue to continue growing at 3% or better on an annualized basis.
AT&T's wireless business segment is currently the third-largest provider in the United States. Additionally, the company’s communications infrastructure is expansive, reaching 290 million people in approximately 24,000 cities and towns. Since 2019, AT&T has invested more than $145 billion in the buildout of that network, including thousands of miles of fiber and 5G.
AT&T Stock Price Target and Rating
All of that culminates in a consensus Moderate Buy rating, with 18 of 25 analysts covering AT&T assigning it a Buy rating, six assigning it a Hold rating, and just one assigning it a Sell rating.
Looking down the line, the stock’s average price target is $29.17, or 6.04% potential upside from where it’s trading today.

New Federal Land Rush About to Start?
New Federal Land Rush About to Start?
MarketBeat Media, LLC dba TickerReport
345 N Reid Place, Suite 620, Sioux Falls, SD 57103.