
Ticker Reports for March 13th
Micron Stock Spikes 7%—3 Key Catalysts Behind the Move
Micron (NASDAQ: MU) stock surged 7% on March 12th, catalyzed by the February CPI report. The CPI report was better than expected, showing inflation cooling compared to the previous month and alleviating some market fear.
Assuming the CPI continues to moderate in the coming months, it will allow the FOMC to cut interest rates again and mitigate some of the risk associated with Trump’s tariffs. But that’s not why Micron’s stock surged.
Micron’s stock surged because macroeconomic headwinds and uncertainty caused it to trade near long-term lows, where it presented a deep value.
1. Micron Is a Deep Value for AI Investors
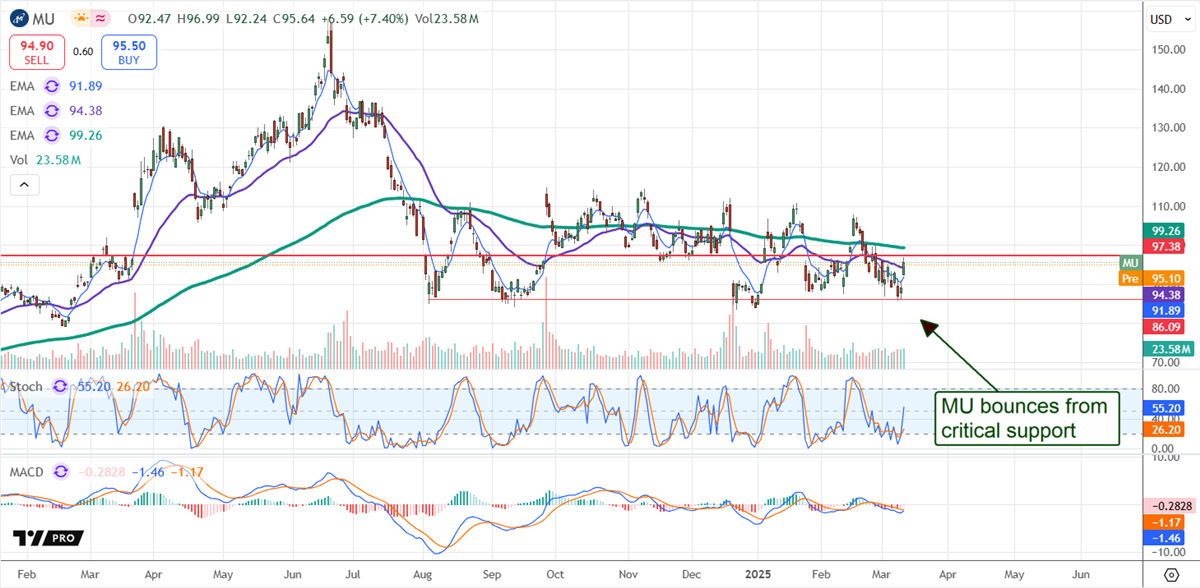
Micron’s stock price advance confirmed support at the bottom of a long-term trading range, where it traded at rock-bottom pricing. The stock still trades at only 14x this year’s earnings with a forecast for growth centered in AI. Micron’s position in the HBM3E semiconductor market is assured, with its technology providing better performance at lower power consumption rates.
Although analysts' estimates for FQ2 have fallen over the past few months, they remain strong. They forecast 36% topline growth and a widening margin, and the long-term outlook is equally robust.
The consensus forecast reported by MarketBeat expects mid-30% growth in 2026, and it may be low due to results from NVIDIA (NASDAQ: NVDA). NVIDIA beat on the top and bottom line and raised its guidance as demand for its data center/AI GPUs increases.
Micron’s HBM3E is critical to NVIDIA’s GPU production, including the Blackwell and upcoming Rubin product lines. The takeaway is that Micron’s P/E multiple falls to 8x EPS relative to 2026 and lower compared to 2027 expectations, suggesting the stock price could double over the next 12 to 18 months.
2. Analysts Sentiment Firms, Forecasts 40% Upside
Micron analysts have moderated their stock price targets since the Q1 release, but their data trends are otherwise bullish. The number of analysts with current coverage has been steady while sentiment firmed within the Moderate Buy range.
The Moderate Buy rating has a bullish bias because 89% of analysts rate the stock at a Buy or better rating with only two holds and one sell.
While down compared to late December 2024, the price target forecasts a 40% upside, and the revision trends show conviction firming around this range. Citigroup is the most recent to issue coverage, calling Micron one of the two top AI-related picks despite broad sector weakness in January.
AI demand remains strong, is 20% of total semiconductor demand, and will be compounded by normalization in other end-markets as the year progresses. Citi expects total annual semiconductor sales to rise by nearly 18%.
3. Institutional Buying Spikes in Q1 2025
Institutional trends for Micron are solid, pointing to higher stock prices over time. The trends include buying on balance for 2024 despite a Q4 selling spike and the ramping buying activity to a multiyear high in Q1 2025. The Q1 2025 activity netted 5.3% of the market cap, with shares trading near $95 and can be expected to remain bullish in 2025.
Not only is the business expected to stay solid in 2025 and 2026, but cash flow is also driving balance sheet improvement and dividend distribution. Dividends aren’t robust, with an annualized yield near 0.5%, but they are compounded by positive cash flow, low leverage, and a 3.75% year-over-year equity increase in Q1.
The Technical Outlook: Micron Stock Is Range Bound
Micron’s stock surged more than 7% following the CPI report, but the market remains range-bound with a top near $110. The price action will likely extend its rebound and approach the critical resistance target in Q2 but may not break out to new highs until later in the year. The catalysts include the upcoming Q2 earnings report and the potential for outperformance relative to the low bar set by analysts.

DividendStocks for Beginners
If you're not familiar with how to build a strong, reliable dividend portfolio… or where to begin…
We've got the hookup for you.
A young investor who's obsessed with dividends put together a set of 5 dividend "cheat sheets" meant to take you from 0 to what could be a full blown dividend portfolio as quickly as possible…
The best part?
Right now, the five dividend cheat sheets are FREE

Gold Rally vs. Oil Surge: Where Investors Are Betting Next
Today, just like United States treasury bonds in the iShares 20+ Year Treasury Bond ETF (NASDAQ: TLT) has rallied as the United States dollar has sold off, a similar rotation might be about to come in between the price of gold and oil, where the basic materials sector (mining stocks specifically), and the energy sector will see the bulk of the price action in the coming months.
By tracking the price action between the two areas of the economy, like the SPDR Metals & Mining ETF (NYSEARCA: XME) alongside the Energy Select Sector SPDR Fund (NYSEARCA: XLE), investors can clearly see that the market is beginning to gain a preference for one over the other, as energy has outperformed mining by as much as 10% over the past month alone, which is where the question of whether gold can keep rallying or pull back is born.
Gold and Oil: A Historically Strong Correlation
There are still plenty of reasons to believe that gold can keep rallying, such as inflation and the decline of the dollar. However, recent gold rallies might have priced in some of these factors already. If this fear is present amongst the gold bulls, a global macro approach might help them cut some potential pullback risks.
Considering that the United States and China manufacturing PMI indexes have started to swing into expansion readings this quarter, investors should consider some of the reasons Warren Buffett has remained bullish on oil through his continued accumulation of Occidental Petroleum Co. (NYSE: OXY).
It is clear that global manufacturing activity breakouts will bring on added oil demand, helping stocks like Occidental and others higher in the value chain, such as Transocean Ltd. (NYSE: RIG) or the United States Oil Fund LP (NYSEARCA: USO), which might become hedges to portfolios which are still long oil today.
More than that, considering that both gold and oil are correlated commodities, with an average correlation of up to 50%, investors can see that today’s negative correlation (hence the massive gap in performance between gold and oil) creates a fundamental and statistical opportunity to profit while still protecting a gold position.
Wall Street analysts also seem to be behind this theme. They currently have a $5.42 price target on shares of Transocean stock, calling for up to 82% upside from where the stock trades today. Helping reiterate the bull thesis on oil and drillers, the Vanguard Group has also stepped in to back the view up with additional buying.
As of February 2025, the group boosted its holdings in Transocean stock by 1.2%, bringing their net position to a high of $295.4 million, or 9% ownership in the company.
Gold Price Trends Could Drive Barrick Higher
One gold mining stock that may not have fully priced in the upside from gold’s rally is Barrick Gold Corp. (NYSE: GOLD), and even its own management recognizes this today. As of the past quarter, the latest round of corporate buybacks included this stock, signaling insiders see it as cheap and filled with upside today.
More than that, Wall Street analysts decided to focus on Barrick Gold as a potential winner in case gold prices pull back from where they have climbed to today. Those from Raymond James specifically have landed on an Outperform rating on Barrick Gold, as well as a $24 per share valuation on it to call for as much upside as 30% upside from where it trades today.
As bullish as this may seem, others on the institutional side were willing to bet on this view as well, such as Capital International Investors, the largest institutional holder of Barrick Gold stock today. As of February 2025, they decided to boost their stake by 136.1% in the company.
After this allocation, the group now holds up to $516 million worth of Barrick Gold stock or 1.9% ownership in the company. This reiterates the fact that this stock still can offer a fantastic risk-to-reward ratio in case gold prices pull back and close the gap to oil.

$2 Trillion Disappears Because of Fed's Secretive New Move
$2 trillion has disappeared from the US government's books.
The reason why is a new, secretive move being carried out by the Fed that has nothing to do with lowering or raising interest rates... but could soon have an enormous impact on your wealth.

IGV: Play the Next Phase of the AI Movement With This ETF
When discussing progress made in AI technology so far, a common phrase stated one way or another is “We’re in the early innings." Baseball references aside, it is largely thought that the buildup of AI infrastructure is part of the first stage of this new technology. In 2022, ChatGPT showed how useful large language models (LLMs) can be. This sparked big investments over the following years. Four hyperscaler firms will invest over $300 billion in AI infrastructure in 2025.
However, AI infrastructure won’t have a fully revolutionary impact on society in a vacuum. To do this, the world will need revolutionary AI applications, particularly software. Many see this as the next phase of AI. This brings up an interesting fund, the iShares Expanded Tech-Software Sector ETF (BATS: IGV). It holds many software companies that are developing AI products. So, does this ETF offer a strong way to play the next phase of AI while reducing company-specific risk?
IGV: Holdings Deep Dive and AI Exposure Analysis
Looking at IGV’s holdings reveals it has a large stake in companies deeply involved in using software to further AI. It has an 8.7% weight in Microsoft (NASDAQ: MSFT), essentially tied for its largest holding with Oracle (NYSE: ORCL) as of Mar. 10. Microsoft plays in both the AI infrastructure and software space. Its Azure platform provides computing infrastructure that AI software can run on in the cloud.
Additionally, the firm has made a significant investment in OpenAI, the maker of ChatGPT. According to the Wall Street Journal, the company is effectively entitled to 49% of the earnings in OpenAI’s for-profit arm, up to a certain limit. At this point, OpenAI is the preeminent name in AI applications.
Meanwhile, Oracle also plays a significant role in AI infrastructure and software. The company mentioned in its latest earnings call that its Autonomous Database product grew by 42%, an increase from last year's 32% growth. The Autonomous Database uses AI to help develop applications, analyze data, and automate low-value-added tasks. Oracle’s place as an enterprise resource planning stalwart gives it a strong inn with many large businesses, which can help Oracle expand its AI software relationships over time.
IGV also allocates significantly to some of the more high-flying and pure-play software names committed to AI. This includes stocks like Salesforce (NYSE: CRM) and Palantir Technologies (NASDAQ: PLTR). These companies have been largely building their businesses around AI applications or shifting their focus significantly toward them.
Overall, many of the over 100 software companies within IGV are building or have already built software tools focused on AI. However, this focus varies significantly from holding to holding. For some, everything revolves around AI, while for others, it is far from the main area of importance.
IGV: Software Focus Has Advantages Over Other Funds
One interesting aspect of IGV compared to other funds with AI in their names is that it doesn’t include firms centered on robotics. For example, the Global X Robotics & Artificial Intelligence Thematic ETF (NASDAQ: BOTZ) has a large weighting toward robotics-centric stocks.
Its 33% weighting in the industrials sector exemplifies this. This is important to point out due to the difference in profitability for robotics firms versus software companies. High margins, scalability, and recurring revenue characterize software.
Meanwhile, robotics companies can have trouble achieving even positive gross margins. Their products also take a long time to build, and sales deals can have complicated revenue recognition structures. This can create significant revenue and earnings volatility, offering higher potential rewards for companies that navigate these challenges successfully but also increasing overall risk.
Thus, this risk and reward relationship bleeds down to the ETF. In comparison, software companies investing in AI can be thought to have a lower risk and lower reward profile.
IGV: Providing Diverse AI Software Exposure in Tech, But Sector Risks Remain
Overall, IGV offers an interesting way to play what many see as the next phase of AI. It has notable advantages and downsides compared to other funds or individual stocks. Its 123 holdings help limit individual stock risk. However, that also reduces its effectiveness as a pure-play AI investment.
Additionally, it is still directly exposed to the volatile tech sector, which has gotten battered lately. These dynamics make considering IGV worthwhile, but understanding its pitfalls is essential.
MarketBeat Media, LLC dba TickerReport
345 N Reid Place, Suite 620, Sioux Falls, SD 57103.